Daily Analysis of Toyota Motor Corporation (TM) – July 11, 2025
📊 Comprehensive Analysis of Toyota Motor Corporation (TM)
Company Overview
- 📌 Symbol: TM
- 🏢 Company: Toyota Motor Corporation
💼 Balance Sheet Analysis
The financial data required to perform a comprehensive balance sheet analysis is currently unavailable. Key indicators such as revenue, costs, profits, cash flows, assets, liabilities, and equity are missing. Once this data is provided, a detailed analysis can be conducted, including the evolution of revenue, costs, and operating and net income, as well as the calculation and analysis of margins, EPS, return per share, and financial structure.
💰 Financial Analysis
Due to the lack of available data on Yahoo Finance for Toyota Motor Corporation (TM), a comprehensive financial analysis cannot be conducted. The absence of key metrics such as analyst recommendations, EPS estimates, revenue estimates, and trends prevents an accurate assessment of market sentiment, growth consistency, and implied risks. Consequently, it is not feasible to provide a rating for the stock's attractiveness at this time. For a thorough evaluation, additional data sources or direct access to financial reports may be necessary.
📈 Technical Analysis
Current Technical Situation
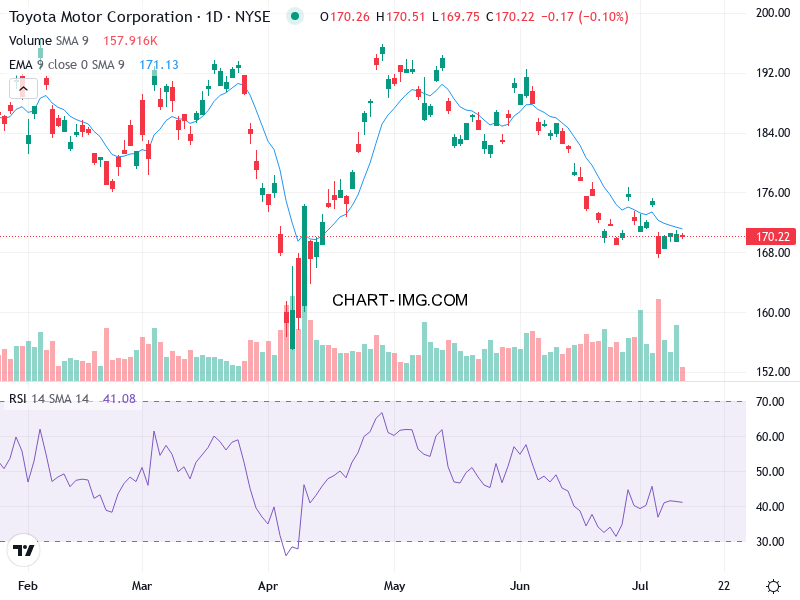
The stock is in a sideways consolidation phase with a slight bearish bias. The EMA21 is declining, and the price has been trading below it for most of the last 30 days, indicating weak short-term momentum. The highs and lows are contracting, suggesting reduced volatility and potential consolidation. The price is below the EMA21, which is currently at ~173.87, and there have been no sustained crossovers recently, reinforcing the lack of strong directional bias.
Bollinger Bands and MACD
The price is hovering near the lower Bollinger Band (~165.99), indicating potential oversold conditions. The bands are tightening, suggesting low volatility and possible consolidation before a breakout. The MACD line is below the signal line, indicating bearish momentum. The histogram is negative but flattening, suggesting weakening bearish pressure. The MACD is in negative territory, reinforcing the short-term bearish bias.
Volume and RSI
Volume has been moderate to low, with no significant spikes confirming price movements. The lack of strong volume on recent declines suggests weak selling pressure. The RSI is ~41.10, which is neutral (not overbought or oversold). There is no clear divergence, but the RSI is flat, indicating a lack of strong momentum.
ADX and Recommendation
The ADX is ~19.63, indicating a weak trend (below 25). The ADX has been declining, suggesting further weakening of trend strength. The -DI is slightly dominant, reinforcing the bearish bias. The recommendation is to Hold (with caution). Monitor for a breakout above EMA21 (~173.87) or a breakdown below the lower Bollinger Band (~165.99). Take profits or apply stop loss if the price breaks below $165 (lower Bollinger Band).
Chart Reference
📰 Sentiment Analysis
The overall sentiment towards Toyota is mixed with a positive bias. Positive articles highlight Toyota's strategic partnerships, innovation in the self-driving cars market, and its commitment to open-source software. However, negative articles discuss the potential financial impact of tariffs on Toyota's operations and profitability. The most frequent reasons behind the positive sentiment are Toyota's strong presence in the electric vehicle market, collaboration with companies like Joby Aviation and Nvidia, commitment to safety technologies, and investment in open-source software.
A potential warning sign is the financial impact that tariffs may have on Toyota's operations. Multiple articles mention the significant financial burden that tariffs could impose on Toyota, potentially reducing its operating income and operating profit in the near future. Based on the analyzed texts, the market's perception of Toyota is cautiously optimistic. While there are concerns about the impact of tariffs on Toyota's financials, the company's involvement in promising markets, strategic partnerships, and commitment to innovation provide reasons for optimism.
🔑 Conclusion and Final Recommendation
Recommendation: Hold
Based on the mixed sentiment and technical analysis, the recommendation for Toyota Motor Corporation (TM) is to Hold. The stock is currently in a consolidation phase with a slight bearish bias, and the technical indicators suggest weak momentum and low volatility. The market sentiment is cautiously optimistic, with concerns about tariffs but positive outlook due to strategic partnerships and innovation.
Key Findings
- The stock is in a sideways consolidation phase with weak short-term momentum.
- The RSI is neutral, and the ADX is weak, indicating no strong trend.
- The market sentiment is mixed with a positive bias, with concerns about tariffs but optimism due to strategic partnerships and innovation.
Time Horizon
The recommended time horizon for this hold position is short-term (14 to 30 days). Monitor for a breakout above EMA21 (~173.87) or a breakdown below the lower Bollinger Band (~165.99).
Confidence Level
The confidence level for this recommendation is low (2/5) due to mixed signals and the lack of strong trend or momentum.
Advice for Investors
Investors should monitor the stock closely for any breakout or breakdown. Take profits or apply stop loss if the price breaks below $165 (lower Bollinger Band). Additionally, keep an eye on developments related to tariffs and their potential impact on Toyota's financials.
Interested in stock performance? Visit our regularly updated section on equity market insights with daily commentary powered by artificial intelligence.
Dive into our dedicated section on Technical Analysis, where we break down charts, signals, and market structure across assets.
Looking for cryptocurrency trends? Don’t miss the latest crypto analysis reports that combine technical indicators, sentiment signals, and real-time data.
Explore a full archive of Bitcon market analyses, including technical patterns, price trends, and AI-generated forecasts.


Comments
Post a Comment