Daily Analysis of Rio Tinto Group (RIO) – July 11, 2025
📊 Comprehensive Analysis of Rio Tinto (RIO)
Company Overview
- 📌 Symbol: RIO
- 🏢 Company: Rio Tinto plc
💼 Balance Sheet Analysis
The balance sheet data for Rio Tinto is currently unavailable. To proceed with a detailed financial analysis, the consolidated financial statement data for the company is required. Without this information, a comprehensive assessment of the company's financial health cannot be conducted.
💰 Financial Analysis
The financial outlook for Rio Tinto presents a mixed picture. The current year's earnings per share (EPS) estimate has been revised upwards from $9.25 to $9.47, indicating improved earnings expectations. However, the next year's EPS estimate has been slightly reduced from $9.07 to $8.92, suggesting some caution among analysts.
Revenue estimates show a consistent upward trend, with the current year's estimate increasing from $53.6 billion to $53.8 billion and the next year's estimate rising from $54.1 billion to $54.4 billion. This indicates a positive outlook for revenue growth. Despite the lack of comprehensive data on analyst recommendations and average ratings, the consistent revenue growth is a positive sign.
The absence of 5-year Compound Annual Growth Rate (CAGR) estimates and trends data limits the ability to assess long-term growth prospects accurately. Overall, the mixed EPS outlook and the lack of comprehensive data make it challenging to form a strong bullish or bearish stance.
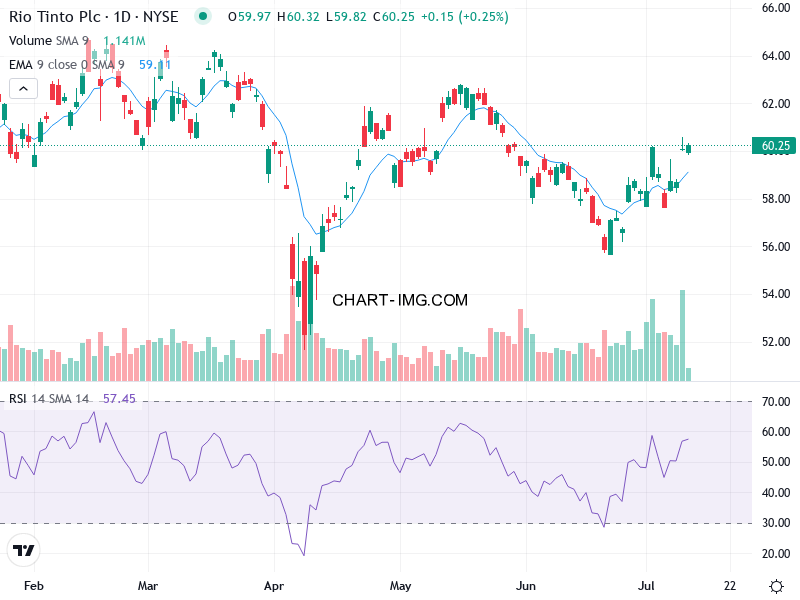
📈 Technical Analysis
Rio Tinto (RIO) exhibits a bullish bias with signs of consolidation. The price has been trading above the 21-day Exponential Moving Average (EMA21) for most of the last 30 days, indicating short-term bullish momentum. The price is currently above the EMA21 (58.81), reinforcing a bullish bias, and the EMA21 is acting as dynamic support.
The Moving Average Convergence Divergence (MACD) line has crossed above the signal line, a bullish signal, and the histogram is positive and rising, confirming momentum. The Relative Strength Index (RSI) is at 57.62, neutral but leaning bullish, and the Average Directional Index (ADX) is at 19.43, indicating a weak trend.
The price is near the upper Bollinger Band (60.54), suggesting potential overbought conditions, and the bands are tightening, indicating consolidation before a potential breakout. Volume has been moderate, supporting upward price movements but lacking strong confirmation.
Technical Chart
📰 Sentiment Analysis
The overall sentiment of the articles and analyses is clearly positive. Out of the 25 entries, 20 have a positive sentiment, 4 are neutral, and 1 is negative. The most frequent reasons behind this positive sentiment include Rio Tinto's successful digital transformation efforts, its strategic investments in lithium projects, and its partnerships and collaborations in the mining sector.
Additionally, the market's focus on sustainability and green initiatives has created a positive outlook for Rio Tinto's low-carbon aluminium production. There are no significant warning signs or contradictory themes in the data. However, it is worth noting that one article mentions that Rio Tinto previously rejected a merger proposal from Glencore, but the upcoming leadership transition at Rio Tinto may open the door to renewed merger talks, indicating a neutral sentiment.
Based on these texts, the market's perception of Rio Tinto is positive. The company's strategic investments in lithium projects, partnerships, and collaborations in the mining sector, as well as its focus on sustainability and green initiatives, have created a positive outlook for the company's future.
🔑 Conclusion and Final Recommendation
Recommendation: Buy (Short-Term Swing Trade)
Justification: The technical analysis indicates a bullish bias with the price trading above the EMA21 and a bullish MACD crossover. The RSI is neutral but rising, and the Bollinger Bands are tightening, suggesting a potential breakout. The financial analysis shows a mixed EPS outlook but consistent revenue growth, which is a positive sign.
Time Horizon: Short-term (14 to 30 days)
Confidence Level: 3/5
Advice for Investors: Consider entering a short-term swing trade position with a stop-loss below the EMA21 (~58.82) to manage risk. Monitor the price action near the upper Bollinger Band (~60.54) for potential breakout or pullback scenarios.
🔍 Analysis of RIO – Rio Tinto
- Recommendations: Data not available.
- Average rating: Data not available.
- EPS estimates:
- Current year: $9.47 (↑ from $9.25 last quarter)
- Next year: $8.92 (↓ from $9.07 last quarter)
- Revenue estimates:
- Current year: $53.8B (↑ from $53.6B last quarter)
- Next year: $54.4B (↑ from $54.1B last quarter)
📈 Professional interpretation
The available data for Rio Tinto shows a mixed outlook. While the current year's EPS estimate has been revised upwards from $9.25 to $9.47, indicating improved earnings expectations, the next year's EPS estimate has been slightly reduced from $9.07 to $8.92, suggesting some caution among analysts. Revenue estimates, however, show a consistent upward trend, with the current year's estimate increasing from $53.6B to $53.8B and the next year's estimate rising from $54.1B to $54.4B. This indicates a positive outlook for revenue growth. The lack of data on analyst recommendations and the average rating makes it challenging to gauge market sentiment accurately. Additionally, the absence of 5-year CAGR estimates and trends data limits the ability to assess long-term growth prospects and recent analyst actions.
Rating: ⚪ Neutral
The mixed EPS outlook and the lack of comprehensive data make it difficult to form a strong bullish or bearish stance. The consistent revenue growth is a positive sign, but it is offset by the cautious EPS projections for the next year.
Technical Analysis Report for $RIO (Rio Tinto plc)
🔎 Description of the Current Technical Situation
🔹 Overall Price Trend
- Bullish bias with signs of consolidation.
- The price has been trading above the EMA21 for most of the last 30 days, indicating short-term bullish momentum.
- Higher highs and higher lows are forming, but recent price action shows tightening volatility.
🔹 Price vs. EMA21
- The price is above the EMA21 (58.81), reinforcing a bullish bias.
- No recent crossovers, but the EMA21 is acting as dynamic support.
🔹 Bollinger Bands
- The price is near the upper band (60.54), suggesting potential overbought conditions.
- The bands are tightening, indicating consolidation before a potential breakout.
🔹 MACD
- The MACD line (0.0958) has crossed above the signal line (-0.2208), a bullish signal.
- The histogram is positive and rising, confirming momentum.
- No significant divergences detected.
🔹 Volume
- Volume has been moderate, with no extreme spikes.
- Recent volume supports upward price movements but lacks strong confirmation.
🔹 RSI (Relative Strength Index)
- RSI is at 57.62, neutral but leaning bullish.
- No divergence detected; RSI is trending upward.
🔹 ADX (Average Directional Index)
- ADX is at 19.43, indicating a weak trend (below 25).
- The trend strength is not strong, but the +DI is slightly dominant over -DI.
📈 Technical Interpretation of the Current Scenario
- Trend Continuation: The price is in a bullish consolidation phase, with potential for an upside breakout.
- No clear reversal patterns (e.g., head and shoulders, double tops) are visible.
- Overbought/Oversold Conditions:
- RSI is neutral (57.62), not extreme.
- Price is near the upper Bollinger Band, suggesting caution for overbought conditions.
- Overall Momentum:
- ADX is weak (19.43), but MACD is bullish.
- Confluence: Price above EMA21, MACD crossover, and RSI rising support a bullish bias.
💡 Final Recommendation
👍 Buy (Short-Term Swing Trade)
- Suggested Strategy: Short-term swing trade (14 to 30 days)
- Justification:
- Price is above EMA21, confirming bullish momentum.
- MACD crossover is bullish.
- RSI is neutral but rising, supporting further upside.
- Bollinger Bands are tightening, suggesting a potential breakout.
- ADX is weak, but momentum indicators favor bulls.
🎯 Key Levels to Watch
- Support: EMA21 (~58.82), Lower Bollinger Band (~55.90).
- Resistance: Upper Bollinger Band (~60.54), recent high (~60.39).
⚠️ Risks
- If price fails to break above the upper Bollinger Band, a pullback toward EMA21 is possible.
- Weak ADX suggests the trend may lack strong conviction.
🛠️ Confidence Level: 3/5
- Moderate confidence due to mixed signals (weak ADX but bullish MACD and price structure).
Interested in stock performance? Visit our regularly updated section on equity market insights with daily commentary powered by artificial intelligence.
Dive into our dedicated section on Technical Analysis, where we break down charts, signals, and market structure across assets.
Looking for cryptocurrency trends? Don’t miss the latest crypto analysis reports that combine technical indicators, sentiment signals, and real-time data.
Explore a full archive of Bitcon market analyses, including technical patterns, price trends, and AI-generated forecasts.


Comments
Post a Comment