Daily Analysis of General Electric Company (GE) – July 11, 2025
📊 Comprehensive Analysis of General Electric Company (GE)
Company Overview
- 📌 Symbol: GE
- 🏢 Company: General Electric Co.
💼 Balance Sheet Analysis
General Electric Co. (GE) has shown mixed financial performance over recent periods. Revenue and net income peaked in FY 2024 but exhibited slight declines in subsequent quarters. Margins have improved in Q1 2025, indicating better cost management. EPS figures have also shown significant improvement, reflecting better profitability per share.
Cash flow from operations has been positive but fluctuating, while investing cash flow has been negative, indicating ongoing investments. The high debt/equity ratio is a concern, suggesting significant leverage. However, the current ratio remains above 1, indicating adequate liquidity.
Overall, while GE has shown some positive trends in profitability and liquidity, the high leverage and fluctuating cash flows pose financial risks. Continued focus on cost management and debt reduction will be crucial for sustained financial health.
💰 Financial Analysis
The financial analysis reveals a slight decline in revenue from Q3 2024 to Q1 2025, with costs and expenses remaining high, impacting operating income. Net income followed a similar trend to operating income, with a notable peak in FY 2024. Gross margins have been relatively stable, with a slight decline in Q1 2025. Operating and net margins have shown improvement in Q1 2025 compared to previous quarters.
EPS figures have shown significant improvement in Q1 2025, indicating better profitability per share. Operating cash flow has been positive but fluctuating, while investing cash flow has been negative, indicating investments in assets. Financing cash flow has been consistently negative, reflecting debt repayments or dividends.
The debt/equity ratio remains high, indicating significant leverage. The current ratio is above 1, suggesting adequate liquidity to cover short-term obligations. Trends show fluctuations in revenue and net income, with a notable peak in FY 2024. Risks include high debt/equity ratio and fluctuating cash flows, which could impact liquidity.
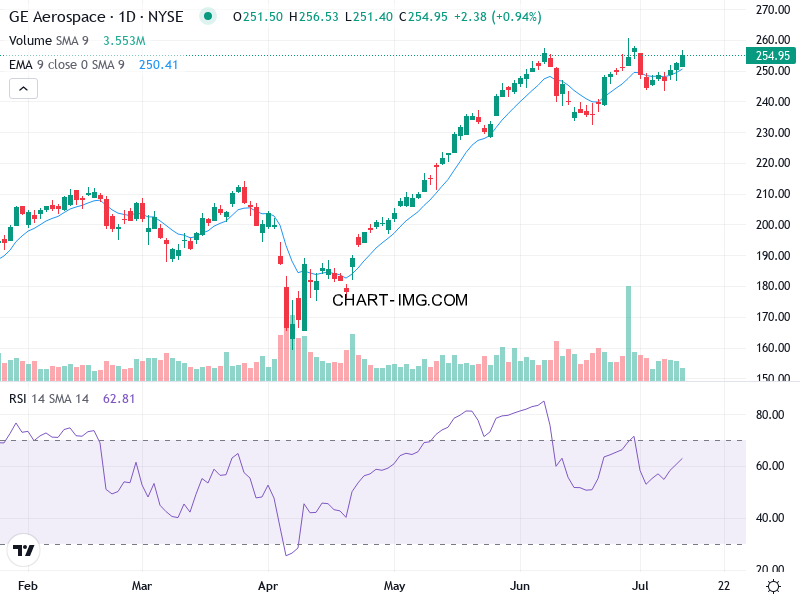
📈 Technical Analysis
The stock is in a bullish trend, as evidenced by higher highs and higher lows over the last 30 days. The price is consistently above the EMA21, which is sloping upward. The ADX (49.34) indicates a strong trend, though it has been declining slightly in recent sessions. The price has remained above the EMA21 for most of the period, confirming bullish momentum.
The Bollinger Bands have been expanding, indicating increasing volatility and trend strength. The MACD is in positive territory but has been declining, with the MACD line recently crossing below the signal line (bearish crossover). Volume has been elevating on up days, confirming bullish moves, but recent volume spikes suggest strong participation, with declining volume in the last few sessions indicating exhaustion.
The RSI (63.05) is in the upper range but not yet overbought, trending downward from extreme overbought levels (~85), suggesting a potential cooling-off period. The ADX (49.34) indicates a very strong trend, though it has been declining from a peak of ~49. The +DI remains dominant, but weakening ADX suggests possible trend exhaustion.
📰 Sentiment Analysis
The overall sentiment towards GE's stock is clearly positive. The majority of analyses highlight GE's strong market position, technological advancements, and significant deals in the aerospace and power supply equipment markets. GE's market leadership in commercial aerospace and defense engines, its involvement in the growing green hydrogen market, and substantial deals like the one with Qatar Airways contribute to this positive sentiment.
GE's commitment to expanding its aerospace business through investments in state-of-the-art MRO facilities and its dominant position in commercial airplane engines further bolster the positive outlook. However, there is a slight concern that GE Aerospace may not see the same level of gains as pure-play defense contractors due to its hybrid business model and relatively expensive valuation.
Despite this, the overall sentiment remains positive, driven by robust order growth and proactive measures to mitigate tariff-related costs. Investors should closely monitor GE's near-term margins, as increased LEAP engine deliveries might negatively impact them.
🔑 Conclusion and Final Recommendation
Based on the comprehensive analysis, the recommendation for General Electric Co. (GE) is a Buy with a short-term swing trade horizon of 14 to 30 days. The stock remains in a bullish trend with strong momentum, supported by the rising EMA21 and high ADX. However, short-term indicators suggest a potential pullback or consolidation before resuming the uptrend.
The financial analysis shows improved margins and EPS figures, indicating better profitability and cost management. The sentiment analysis reveals a positive outlook driven by GE's strong market position and significant deals. However, the high debt/equity ratio and fluctuating cash flows pose financial risks that need to be monitored.
Confidence Level: 3/5 (Moderate – Mixed signals with weakening momentum but still bullish structure).
Advice for Investors: Consider entering the stock on a pullback toward the EMA21 (~$247) or the lower Bollinger Band (~$233) with a stop-loss below $240 to protect against a deeper correction.
Interested in stock performance? Visit our regularly updated section on equity market insights with daily commentary powered by artificial intelligence.
Dive into our dedicated section on Technical Analysis, where we break down charts, signals, and market structure across assets.
Looking for cryptocurrency trends? Don’t miss the latest crypto analysis reports that combine technical indicators, sentiment signals, and real-time data.
Explore a full archive of Bitcon market analyses, including technical patterns, price trends, and AI-generated forecasts.


Comments
Post a Comment