Daily Analysis of Ethereum (ETH) -July 11, 2025
📊 Comprehensive Analysis of Ethereum (ETH)
1. Technical Analysis
Price Trends
Ethereum has shown a notable upward trend over the past week. Starting at $2,521 on July 4th, ETH has climbed to $2,965 by July 11th, marking a significant increase. The most substantial price jump occurred between July 8th and July 9th, where the price surged from $2,610 to $2,777, indicating strong bullish momentum.
Trading Volume
Trading volume has seen considerable fluctuations, with a notable spike on July 11th, reaching $41.37 billion. This surge in volume aligns with the price increase, suggesting heightened market activity and interest. The volume trends support the price movements, indicating a healthy market with active participation.
Market Capitalization
Market capitalization has followed the price trend, increasing from $304.21 billion on July 4th to $357.79 billion on July 11th. This rise in market cap reflects growing investor confidence and a positive market sentiment towards Ethereum.
Chart Analysis
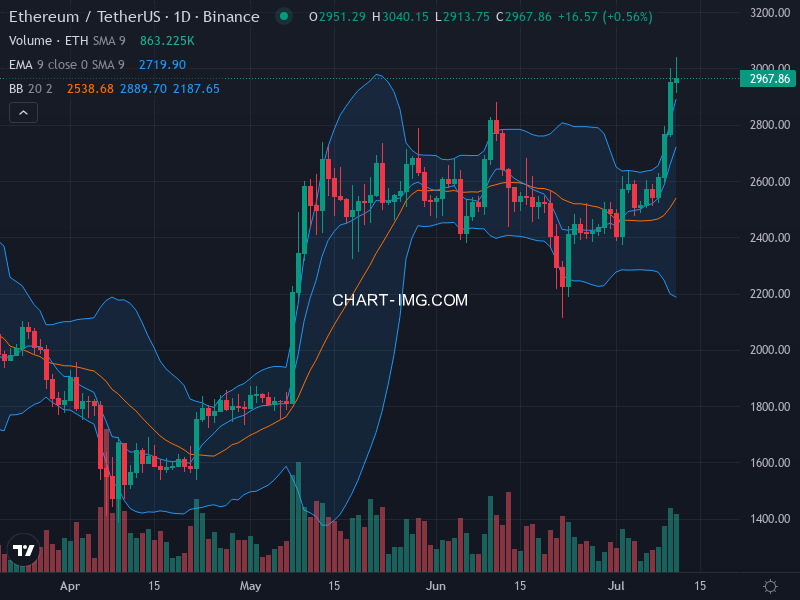
Conclusion
The current trend for Ethereum is bullish. The price trends, trading volume, and market capitalization all point towards a strong upward momentum. The technical chart further supports this bullish outlook, showing consistent buying pressure and positive market sentiment.
2. Sentiment Analysis
3. Final Assessment
Short-Term Market Outlook
The short-term market outlook for Ethereum is bullish.
Investment Recommendation
👍 Buy
4. 🛠️ Confidence Level
The confidence level for this analysis is 4 out of 5.
The technical indicators and market data are strongly aligned, showing a clear bullish trend. The sentiment analysis also supports this outlook, with a consistent and positive narrative across recent headlines. The slight deduction in confidence is due to the absence of specific regulatory news, which could always introduce unforeseen variables.


Comments
Post a Comment