Daily Analysis of Caterpillar Inc. (CAT) – July 11, 2025
📊 Comprehensive Analysis of Caterpillar Inc. ($CAT)
Company Overview
- 📌 Symbol: $CAT
- 🏢 Company: Caterpillar Inc.
💼 Balance Sheet Analysis
Caterpillar Inc. has shown a robust financial performance with consistent revenue growth and stable margins. In Q1 2025, the company reported revenue of $14,249 million, with a gross margin of 37.08%, an operating margin of 18.09%, and a net margin of 14.06%. For the fiscal year 2024, revenue was significantly higher at $64,809 million, with improved margins: gross margin of 37.97%, operating margin of 20.17%, and net margin of 16.65%. The company's ability to generate positive operating cash flow is a strong indicator of operational efficiency. However, the significant negative financing cash flows highlight a reliance on debt or substantial dividend payments.
The financial structure remains highly leveraged, with a debt/equity ratio consistently above 3. This leveraged position could pose financial risks, especially in an environment of rising interest rates. Despite this, the company maintains adequate liquidity, as evidenced by the current ratio. Overall, Caterpillar Inc. exhibits strong operational performance and financial health, but the high leverage and significant financing cash outflows warrant careful monitoring.
💰 Financial Analysis
Caterpillar Inc. has demonstrated robust financial performance with consistent revenue growth and stable margins. The company's ability to generate positive operating cash flow is a strong indicator of operational efficiency. However, the significant negative financing cash flows highlight a reliance on debt or substantial dividend payments.
The financial structure remains highly leveraged, with a debt/equity ratio consistently above 3. This leveraged position could pose financial risks, especially in an environment of rising interest rates. Despite this, the company maintains adequate liquidity, as evidenced by the current ratio.
Overall, Caterpillar Inc. exhibits strong operational performance and financial health, but the high leverage and significant financing cash outflows warrant careful monitoring. Investors should consider the company's ability to manage its debt levels and maintain operational efficiency in the face of potential economic fluctuations.
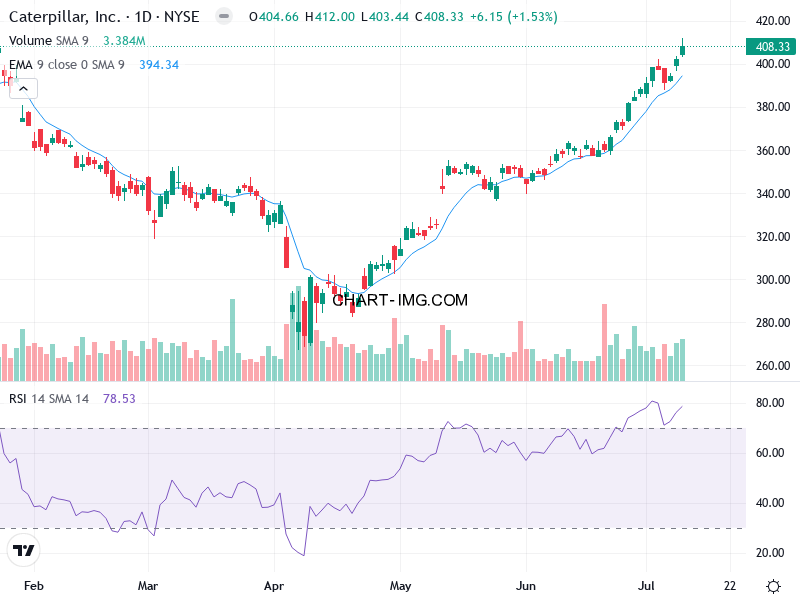
📈 Technical Analysis
Caterpillar Inc. ($CAT) is currently in a strong bullish trend, as evidenced by higher highs and higher lows over the last 30 days. The price is consistently above the EMA21, which is sloping upward, reinforcing the bullish bias. The MACD line is above the signal line and has been rising, confirming bullish momentum. The ADX is very strong (>40), currently at 41.73, indicating a powerful trend. The RSI is in overbought territory (>70), currently at 78.53, indicating potential exhaustion.
The price is touching or exceeding the upper Bollinger Band in recent sessions, indicating potential overbought conditions. The bands are expanding, signaling increasing volatility and trend strength. Volume has been moderate to high, confirming the price uptrend. No unusual spikes, but volume is supporting breakouts rather than suggesting weakness.
The strong ADX, rising EMA21, and MACD bullish crossover suggest trend continuation. However, the RSI in overbought territory and price touching the upper Bollinger Band may indicate short-term exhaustion. The confluence of indicators (MACD, EMA21, volume, ADX) supports the bullish case, but the RSI suggests potential short-term pullback risks.
Chart Reference:
📰 Sentiment Analysis
The overall sentiment towards Caterpillar's stock is clearly positive. Out of the analyzed entries, the majority have a positive sentiment, with only a few neutral and a single negative sentiment. The most frequent reasons behind this sentiment are Caterpillar's global dealer network, strong operating margins, and potential for infrastructure demand. Additionally, many articles mention Caterpillar's solid long-term performance, above-average dividend yield, and consistent dividend growth. Furthermore, the company's innovation in the mining robotics market and its participation in the railway traction motors and hydraulic tiltrotator markets contribute to the positive sentiment.
There are no significant warning signs or contradictory themes in the data. However, one article mentions Caterpillar's exposure to global growth and potential impact of tariff actions on its supply chain, which could negatively impact its sales and competitive positioning. Another article suggests that Caterpillar is at the top of its current cycle, and investors should be cautious about buying the stock due to concerns over its cyclicality, services growth, and pricing power.
Based on these texts, the market's perception of Caterpillar's stock is positive. The company's solid financial performance, commitment to returning cash to investors, and potential to benefit from increased infrastructure investment in the U.S. make it an attractive investment option. However, investors should be aware of the potential risks, such as the impact of tariffs and the company's cyclicality.
🔑 Conclusion and Final Recommendation
Recommendation: 👍 Buy
Justification: Caterpillar Inc. demonstrates strong operational performance with stable margins and positive operating cash flows. The technical analysis indicates a strong bullish trend with robust momentum, although the RSI suggests potential short-term pullback risks. The overall market sentiment is positive, driven by the company's global dealer network, strong operating margins, and potential for infrastructure demand.
Time Horizon: Short-term to medium-term (3 to 12 months)
Confidence Level: 4/5
Advice for Investors: Investors should consider entering positions on potential pullbacks towards the EMA21 or middle Bollinger Band. It is advisable to set a stop-loss below the EMA21 (~$380) to protect against trend reversal. Monitoring the company's ability to manage its debt levels and maintain operational efficiency is crucial, especially in the face of potential economic fluctuations and rising interest rates.
Interested in stock performance? Visit our regularly updated section on equity market insights with daily commentary powered by artificial intelligence.
Dive into our dedicated section on Technical Analysis, where we break down charts, signals, and market structure across assets.
Looking for cryptocurrency trends? Don’t miss the latest crypto analysis reports that combine technical indicators, sentiment signals, and real-time data.
Explore a full archive of Bitcon market analyses, including technical patterns, price trends, and AI-generated forecasts.


Comments
Post a Comment