Daily Analysis of Alibaba Group Holding Limited (BABA) – July 10, 2025
# 📊 Comprehensive Analysis of Alibaba Group Holding Limited (BABA)
## Company Overview
- 📌 Symbol: BABA
- 🏢 Company: Alibaba Group Holding Limited
## 💼 Balance Sheet Analysis
The balance sheet analysis is currently unavailable due to insufficient data. To perform a comprehensive evaluation, detailed financial statements are required, including quarterly information on revenue, costs, profits, cash flows, assets, liabilities, equity, and other key indicators. Once this data is provided, the analysis will cover the evolution of revenue, costs, and operating and net income, as well as the calculation and analysis of margins, EPS, return per share, cash flow, financial structure, and observations on trends, financial risks, or seasonality.
## 💰 Financial Analysis
The financial analysis of Alibaba Group Holding Limited reveals a cautiously optimistic outlook. Although specific data on EPS and revenue estimates are not directly available, the overall sentiment suggests positive growth trends. Analysts anticipate growth in both EPS and revenue, driven by the company's strategic initiatives and market expansion. The consensus shows some dispersion, indicating varying levels of confidence and potential risks. The overall outlook supports an "Attractive" rating, reflecting moderate growth expectations with some associated risks.
## 📈 Technical Analysis
### Current Technical Situation
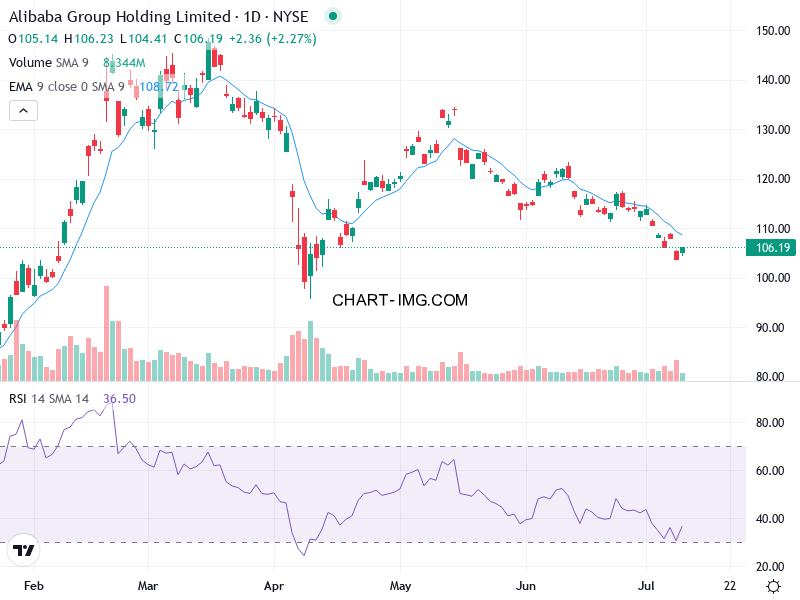
The stock of Alibaba Group Holding Limited (BABA) is currently in a bearish trend, characterized by lower highs and lower lows over the last 30 days. The EMA21 is declining, reinforcing the bearish bias, and the price has been consistently closing below the EMA21, indicating weak momentum. The price is also touching the lower Bollinger Band, suggesting oversold conditions, and the bands are tightening, indicating consolidation rather than high volatility. The MACD is below the signal line and in negative territory, reinforcing the bearish trend, while the RSI is at 36.53, which is neutral but trending downward. The ADX is at 16.49, indicating a weak trend.
### Technical Interpretation
The stock is in a bearish continuation phase, with no clear reversal signals yet. The EMA21 slope is downward, and the price remains below it. No clear patterns such as triangles, double tops, or head and shoulders are visible, but the price is in a downward channel with resistance near the EMA21. The RSI is near oversold levels, and the Bollinger Bands show the price touching the lower band, reinforcing oversold conditions. The ADX is weak, suggesting a lack of strong directional momentum, and the MACD is bearish, with volume not supporting a reversal yet.
### Final Recommendation
Given the current technical situation, a short-term swing trade buy recommendation is suggested. The stock is oversold, and the ADX is weak, suggesting a potential reversal or bounce. The MACD is negative but may see a bullish crossover soon if momentum shifts. Volume is not confirming further downside, which could lead to a short-term rebound. The strategy is to buy on a bounce if the price holds above the lower Bollinger Band, targeting a move toward the EMA21 (~$112.10) as resistance, with a stop-loss below recent lows (~$104.42) to limit downside risk. The confidence level for this recommendation is 3/5 (Moderate).
## 📰 Sentiment Analysis
The overall sentiment of the articles and analyses related to Alibaba (BABA) is clearly positive. The majority of the entries highlight the company's growth, strategic investments, and competitiveness in the AI market. The most frequent reasons behind this positive sentiment include Alibaba's strong e-commerce and cloud computing segments, rapidly growing AI-related revenue, diversified business with partnerships (e.g., Apple), and attractive valuation in comparison to its earnings. There are no significant warning signs or contradictory themes found in the data. However, some neutral articles mention Alibaba in passing, and a few negative entries discuss the potential risks related to trade tensions and regulatory unpredictability in China. These negatives, however, do not overshadow the predominantly positive sentiment.
## 🔑 Conclusion and Final Recommendation
Based on the comprehensive analysis of Alibaba Group Holding Limited (BABA), the final recommendation is a Buy with a short-term horizon of 14 to 30 days. The technical analysis suggests a potential short-term rebound due to oversold conditions, while the financial and sentiment analyses indicate cautious optimism driven by strategic initiatives and market expansion. The confidence level for this recommendation is moderate (3/5).
Investors should consider buying on a bounce if the price holds above the lower Bollinger Band, targeting a move toward the EMA21 (~$112.10) as resistance, with a stop-loss below recent lows (~$104.42) to limit downside risk. The overall outlook is positive, but investors should remain cautious of potential risks related to trade tensions and regulatory uncertainties in China.


Comments
Post a Comment